 Pensum
How Pensum measures your energy expenditure
The full algorithm: the method, every constant, and the benchmark it has to pass.
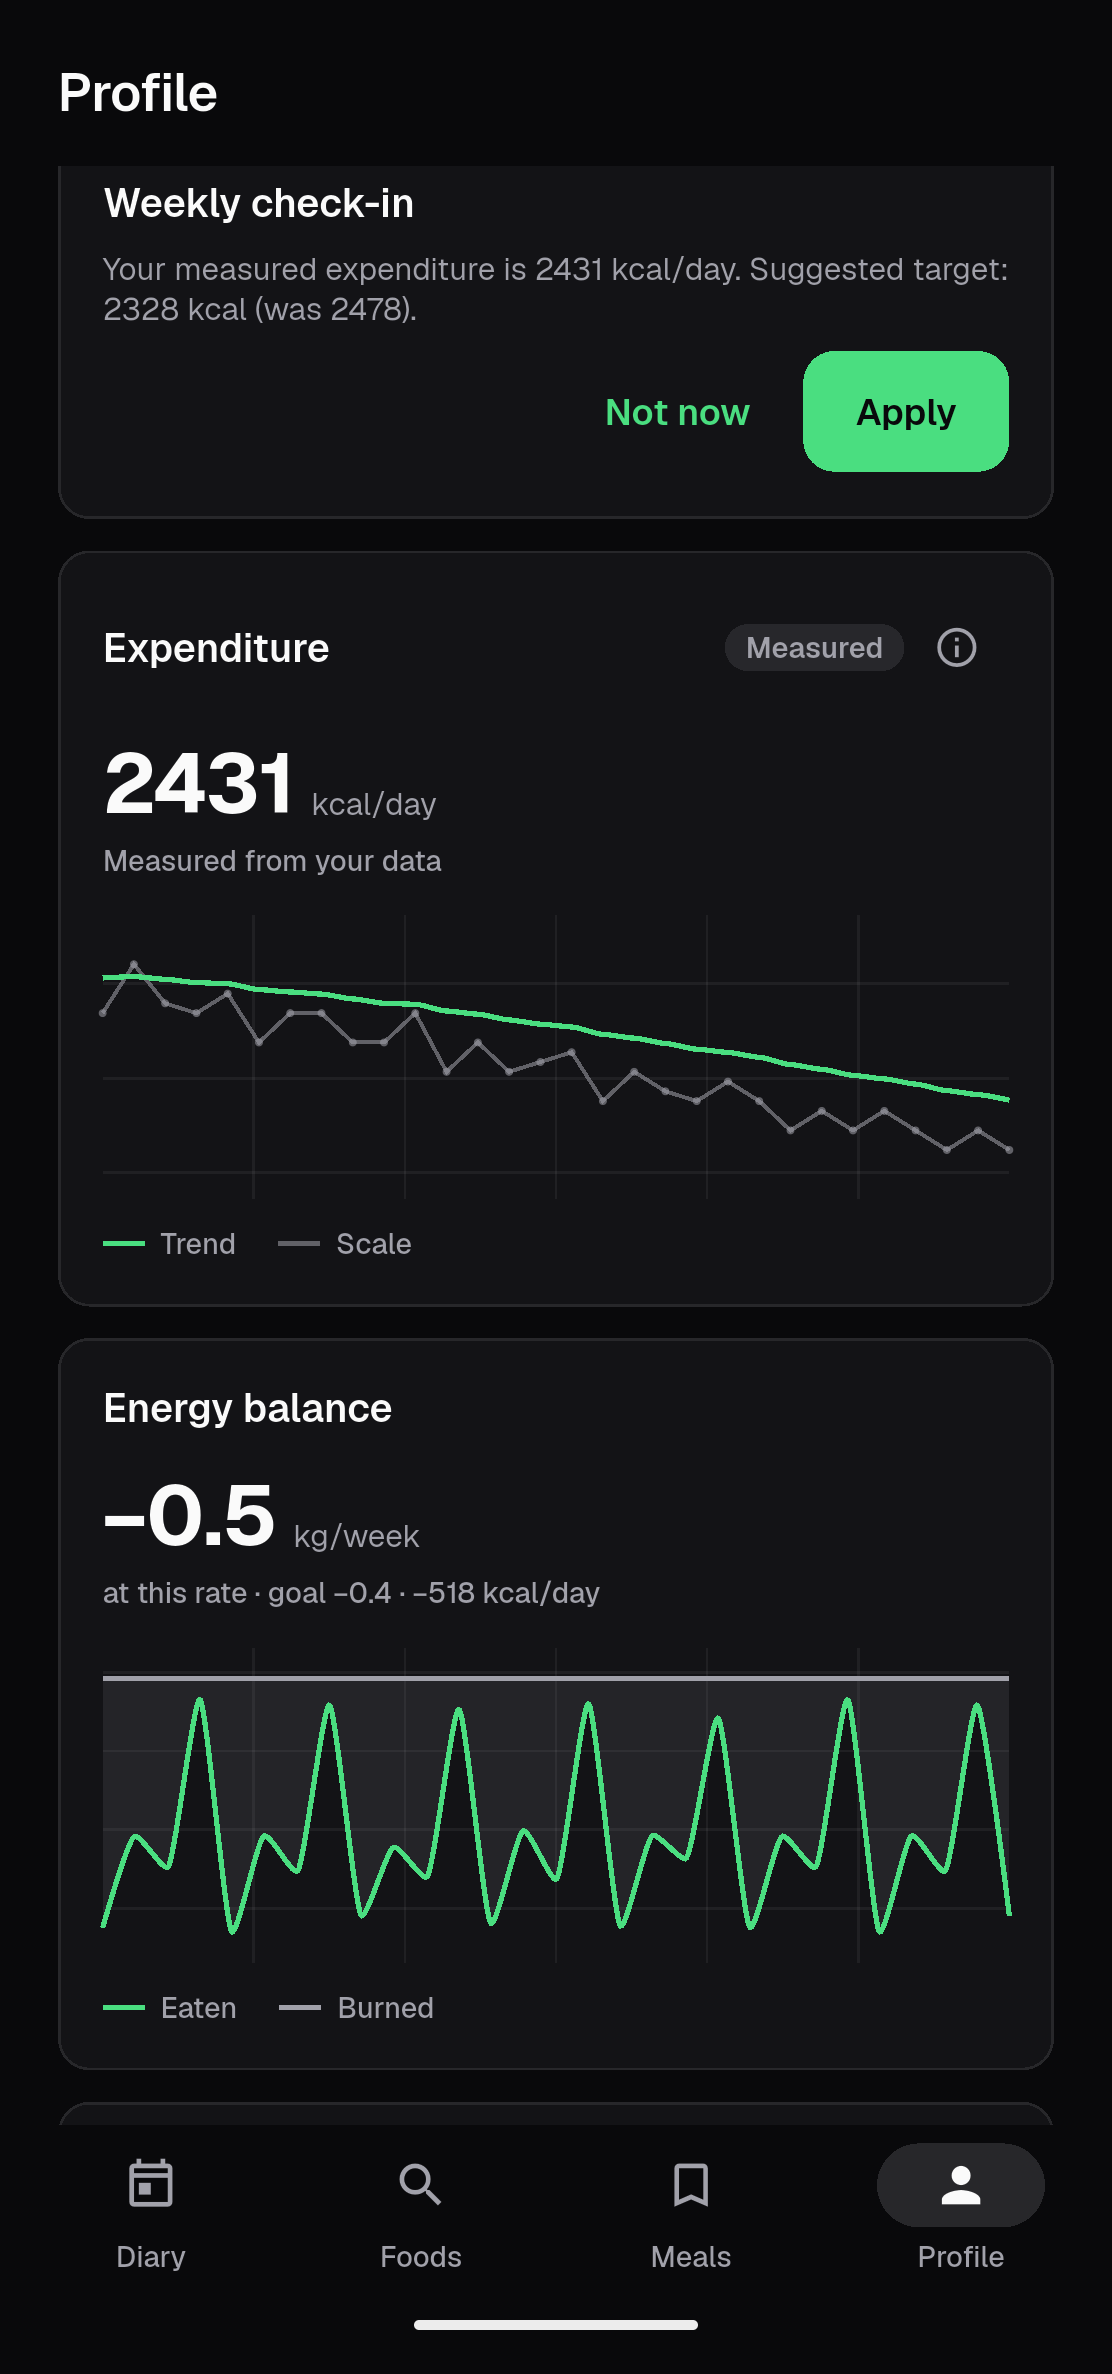
Most trackers hand you a maintenance calorie number from a formula, then never mention it again. The formula reads your height, weight, age and sex, multiplies by an activity guess, and returns a single figure that carries a couple of hundred calories of error on either side and cannot see your actual metabolism. Pensum starts from that same formula, because on day one it is all anyone has. Then it throws the formula away and measures the number from your own data instead: an adaptive TDEE, calculated from your weight trend and your food diary, that moves your calorie target as it changes.
Every equation the app runs, every constant and where it comes from, and the way we test it, including the scenario it handles worst.
The one equation everything rests on
Energy that goes in and does not leave as work or heat is stored, mostly as fat, some as the glycogen and water that ride along with it. Run that backwards and expenditure becomes something you can read off two signals you already record:
expenditure = mean daily intake − (change in stored energy) / days
The stored-energy term comes from body weight. A kilogram of body-weight change is worth roughly 7,700 kcal, the figure Wishnofsky derived in 1958 from the fat content of adipose tissue.1 So if you averaged 2,500 kcal a day for two weeks and your weight trend fell by half a kilogram of tissue over that stretch, you spent about 3,850 kcal out of storage, near 275 a day, and your expenditure was close to 2,775.
The 7,700 figure has a well-known problem. Used as a long-range predictor ("cut 500 a day and you will lose a pound a week forever"), it overstates loss badly, because expenditure itself falls as you get lighter and the composition of what you lose shifts.2 Pensum does not use it that way. It converts the slope you already observed into energy over a two-week window, not a deficit you plan to hold for a year. The number is a reading of what happened, re-taken every day, so the static rule's forecasting failure never enters into it.
Reading energy flux backwards from weight change is not something we invented. Sanghvi and colleagues validated the method against doubly-labelled water, the gold standard for measuring free-living energy use, and found it recovers long-term intake changes accurately.6 Pensum adds the day-to-day machinery that turns a research method into a number stable enough to set a calorie target from.
Why we never trust a single weigh-in
Step on the scale two mornings running and it can move a kilogram with no change in fat whatsoever. Most of that is water. Glycogen alone binds roughly three to four grams of water per gram stored, so a weekend of higher carbs can park one to three kilograms on the scale that leaves again a few days later.3 Feed a raw daily weight into the equation above and the "expenditure" it produces jumps around uselessly.
So the estimator works from a trend rather than the raw readings: an exponentially weighted moving average that moves 10% of the way toward each new weigh-in, the smoothing popularised by the Hacker's Diet. Its half-life is about a week, long enough to shrug off a salty dinner, short enough to follow a real trend within days. Gaps between weigh-ins are filled by straight-line interpolation before smoothing, so a missed day costs nothing.
The slope of that trend line becomes the change-in-storage term.
Where the estimate starts
Before there is enough of your own data to measure anything, the estimator shows a seed: a modern regression-based BMR equation from your body metrics, multiplied by an activity factor. That is the ordinary formula every app uses, and on its own it is a guess with a couple of hundred calories of spread.
To see what that formula gives for you, the TDEE calculator runs the same kind of equation in your browser.
Two corrections go into the seed that a bare formula skips, both drawn from the metabolic-adaptation literature. A sustained calorie deficit suppresses energy expenditure below what your reduced body mass alone would predict. Leibel, Rosenbaum and Hirsch measured expenditure running roughly 15% under prediction at a maintained 10% weight loss.4 The size of that suppression is still argued over; some researchers put it smaller once the measurements are tightly controlled, so we apply a deliberately conservative fraction rather than the largest figure in the literature. Pensum trims 5% off the seed while you are cutting, and a further 3% once you are more than 10% below your heaviest logged weight, where the effect deepens. The second correction removes a known cold-start bias tied to your chosen rate of loss or gain. Both only shape the starting point; within a few weeks the measurement has replaced the seed regardless of where it began.
Turning noisy days into one moving number
Each day, the estimator takes the trailing two weeks. The observed expenditure for that window is the mean of the tracked days' calories minus the trend slope converted to energy:
observed = mean intake − (trend slope, kg/day) × 7700
That daily observation is still noisy, so it feeds a second moving average that puts 20% weight on each new observation. The smoothed value becomes the expenditure the app displays and, if you opt in, the number your calorie targets follow. Three guards sit on top of it:
- A daily step clamp. The shown number can move at most 100 kcal from one day to the next, so a single odd reading can never yank your target around.
- A band around the seed. The estimate is held within 40% of the formula seed. A measurement outside that band means the input data is broken; nobody genuinely burns half or double a physiologically plausible amount.
- A partial-day screen. A tracked day whose calories fall below half the window's median reads as a day you logged breakfast and forgot dinner. It is dropped from the mean rather than counted as a genuine fast, which would otherwise fake a huge deficit.
Missing days inside the window are filled with the median of the same weekday's recent intake, since the systematic error in a plain average is that the days people skip logging are not typical days. And for the first month, while the window is still filling, the two moving-average weights start higher and decay to their steady values by day 30, so a seed that was wrong gets corrected quickly instead of dragging for weeks.
The two things that wreck a naive version
Anyone can code the energy-balance equation. A from-scratch version misbehaves because two ordinary situations feed it a false signal.
1. Switching between cutting and bulking
The day you end a cut and start eating in a surplus, your muscles refill glycogen and pull water in with it, one to three kilograms over a few days.3 Read through the equation, that water gain looks like you suddenly stored a huge amount of energy, which drives the naive expenditure sharply down exactly when your real expenditure is steady or rising.
For 28 days after a change in direction, Pensum trusts each daily observation at a fifth of its usual weight, so the water signal moves the estimate very little. At the same time a predictive adjustment nudges the estimate the way physiology actually moves when you switch diet phase. The 28-day length is deliberate: the trend average itself takes about three weeks to absorb a step in water weight, so a shorter damping window would let the tail leak back out. We tuned that length against the benchmark below.
2. Missing and under-logged data
If you log four days out of seven, the estimator imputes the gaps and carries on. If you log almost nothing for a stretch, it pauses and holds the last value rather than invent one from three data points. Below a full week of data at the very start, it shows the seed untouched, because a number built on that little would just be noise.
The under-reporting problem
Self-reported food intake is inaccurate, and the error runs one way. People under-report what they eat, by around 20% on average in validation studies against doubly-labelled water, and by far more in some groups, with individual gaps of 50% not unusual.5 If your diary systematically under-reads by 15%, then the expenditure Pensum measures reads low by roughly the same 15%. There is no way around that with logged data; the estimator cannot see calories you never entered.
The measurement is still useful, because your calorie target is computed in the same under-logged units the measurement is. If you consistently log 15% light, your measured expenditure comes out 15% low, but so does the target built from it, and the deficit between them, the thing that actually drives weight change, lands where it should. The absolute number is biased; the gap that matters is self-correcting, as long as your logging habits stay consistent. This breaks if your accuracy changes partway through, say you get stricter about weighing. Then the measured expenditure shifts for a reason that has nothing to do with your metabolism, and it will take a couple of weeks to resettle.
How we test it
You cannot check this algorithm's accuracy on real users. Measuring someone's true expenditure requires doubly-labelled water in a lab; free-living, there is no answer key to score against. That applies to everyone in this category, us included. A large user base lets you check that an estimate looks stable and plausible across thousands of histories, which is genuinely useful, but it still cannot tell you how far the estimate lands from the truth. We are earlier than a years-old app at that kind of checking.
The one place the true answer exists is a simulation. So we build worlds where we set the true daily expenditure and the true tissue weight ourselves, evolve the body forward by the same energy-balance law, and then let the estimator see only what the app would see: a diary, and a scale reading that carries the true tissue plus a realistic water and glycogen overlay plus daily weigh-in noise. Because we know the true expenditure in each world, we can score exactly how close the estimate gets. Every scenario is seeded, so the runs are identical every time, and the numbers below are regenerated on every change and guarded by a test so they cannot silently drift.
The simulator and the estimator share the same energy-balance physics: each world is built forward with the same 7,700 kcal/kg conversion the estimator applies backward. So the numbers below cannot show that constant is correct. They test everything layered on top of it: how the estimate handles scale noise, missing days, water artifacts, and real shifts in expenditure, which is where a naive version breaks. The constant itself rests on the human studies cited earlier. Simulated worlds are also not people; they capture energy-balance physics and the main sources of scale noise, and real bodies are messier than the model.
We score three things, the same three MacroFactor's engineering write-ups made the convention in this category, so the numbers orient people who have read those:
- Responsiveness - how well the estimate predicts the next month's tissue change. Lower is a better prediction engine.
- Stability - how much the shown number twitches day to day when nothing real has changed. Lower is calmer.
- Truth error - how far the estimate sits from the true expenditure, in kcal. This is the one only a simulation can give you.
There are nine scenarios. Two of them, a plateau-then-whoosh and a creatine water gain, are held out and never used to tune any constant, so they act as a check that the tuning did not just memorise the cases it was allowed to see.
| Scenario | Held out | What it stresses |
|---|---|---|
| Maintenance noise | - | Flat intake and expenditure; the scale is pure daily water noise. Tests whether the estimate stays still when nothing is happening. |
| Steady cut | - | A real deficit with slow metabolic adaptation underneath. Tests tracking a genuine, gradual change. |
| Activity step | - | Expenditure jumps 300 kcal overnight. Measures how many days to price it in. |
| Cut-to-bulk flip | - | A diet-phase switch with a glycogen-water gain. The estimate must not dip on the water artifact. |
| Plateau then whoosh | yes | Water masks three weeks of fat loss, then releases at once. Held-out validation. |
| Creatine | yes | A one-off water gain with no expenditure change. Held out. The estimate must ignore it entirely. |
| Coin-flip missing days | - | Half the diary deleted at random, ten times over. Tests robustness to gaps. |
| Weekly partial day | - | Every seventh day logged at a third of its real intake. Exercises the partial-day screen. |
| Cold-start bad seed | - | The starting formula is wrong by 15% each way. Measures how fast the error is worked off. |
The results
Steady-state figures, meaning after the first 30 days of calibration. Truth error is the average distance from the true expenditure; stability is the average day-to-day movement. Lower is better in both columns.
| Scenario | Truth error (kcal) | Stability (kcal/day) |
|---|---|---|
| Maintenance noise | 81 | 15 |
| Steady cut | 55 | 7 |
| Activity step | 80 | 7 |
| Cut-to-bulk flip | 30 | 5 |
| Plateau then whoosh (held out) | 230 | 19 |
| Creatine (held out) | 106 | 10 |
| Coin-flip missing days | 31 | 5 |
| Weekly partial day | 15 | 4 |
| Cold-start bad seed | 17 | 4 |
The cut-to-bulk flip sits at 30 kcal of error, where a naive estimator dips by around 170 on the water artifact; that gap is what the transition damping buys. After the overnight 300-kcal activity step, the estimate takes about 23 days to price in 90% of it, the deliberate cost of smoothing hard enough to ignore day-to-day water. The cold-start scenario ends near 17 kcal despite starting 15% wrong, which is the calibration ramp doing its job, and missing half the diary at random moves the final number by under 40 kcal, so the imputation holds up.
The one we handle worst: plateau then whoosh, at 230 kcal of steady-state error. When water masks three weeks of genuine fat loss and then releases all at once, the trend line is actively lying about tissue for most of the window, and the estimate drifts high before the whoosh corrects it. It is our largest error by a wide margin, and it is one of the two scenarios held out from tuning, so we cannot quietly optimise it away.
The creatine case is the other held-out scenario, at 106 kcal. A creatine load parks roughly 1.2 kg of water on the body over about ten days and never returns it. The estimator reads that steady gain as stored energy and trims expenditure while it lands. There is no reversal to correct the mistake, only the trend slowly flattening once the gain stops, so the drift takes a few weeks to clear, and that drift is what the 106 counts. The table says the estimate should ignore this artifact entirely; it does not fully manage that.
The steady constants (the two moving-average weights, the step clamp, the damping window) were picked off a grid search for the best balance of responsiveness and stability, never for winning any single scenario, and never against the two held-out cases. The shipped point wins neither axis on its own; it behaves best across the whole set.
Check it on your own data
Pensum imports your logs from Cronometer, MacroFactor and MyFitnessPal. If you already have months of weigh-ins and diary days in one of those, export them and import them, and the estimator runs on your real history right away. From there you can hold it to account. A measured expenditure is a prediction: at your logged intake, it implies your weight trend should move by a certain amount over the coming weeks. Watch whether it does.
Pensum is a fast, private macro tracker with a measured expenditure engine built on the method above. The adaptive TDEE is free, with no ads and no account. Get Pensum on Google Play, read the vision-model research, or go back to the homepage.
References
- Wishnofsky M. Caloric equivalents of gained or lost weight. American Journal of Clinical Nutrition, 1958;6(5):542-546. doi:10.1093/ajcn/6.5.542. Origin of the ~7,700 kcal/kg (3,500 kcal/lb) convention, derived from the fat content of adipose tissue, not a controlled trial.
- Hall KD, Chow CC. Why is the 3500 kcal per pound weight loss rule wrong? International Journal of Obesity, 2013;37(12):1614. doi:10.1038/ijo.2013.112. And Hall KD et al. Quantification of the effect of energy imbalance on bodyweight. The Lancet, 2011;378(9793):826-837. doi:10.1016/S0140-6736(11)60812-X. Both show the fixed rule overstates long-term loss because expenditure falls as body mass falls.
- Olsson KE, Saltin B. Variation in total body water with muscle glycogen changes in man. Acta Physiologica Scandinavica, 1970;80(1):11-18. doi:10.1111/j.1748-1716.1970.tb04764.x. Measures roughly 3-4 g of water stored per gram of glycogen, the basis for the rapid water-weight swings on carbohydrate refeeding.
- Leibel RL, Rosenbaum M, Hirsch J. Changes in energy expenditure resulting from altered body weight. New England Journal of Medicine, 1995;332(10):621-628. doi:10.1056/NEJM199503093321001. Maintained 10% weight loss lowered expenditure roughly 15% below what body-mass change alone predicts. See also Rosenbaum M, Leibel RL. Adaptive thermogenesis in humans. International Journal of Obesity, 2010;34(S1):S47-S55.
- Schoeller DA. Limitations in the assessment of dietary energy intake by self-report. Metabolism, 1995;44(2 Suppl 2):18-22. And Lichtman SW et al. Discrepancy between self-reported and actual caloric intake and exercise in obese subjects. New England Journal of Medicine, 1992;327(27):1893-1898. doi:10.1056/NEJM199212313272701. Self-report underestimates intake, on average around 20% and considerably more in some individuals and groups (the Lichtman figure comes from a small diet-resistant clinical sample, not the general population).
- Sanghvi A, Redman LM, Martin CK, Ravussin E, Hall KD. Validation of an inexpensive and accurate mathematical method to measure long-term changes in free-living energy intake. American Journal of Clinical Nutrition, 2015;102(2):353-358. doi:10.3945/ajcn.115.111070. Validates recovering energy intake and expenditure from serial body-weight change against doubly-labelled water.